Google Ad Choice

Monday, March 28, 2011

MHB Time to take profit

This could be a good time to take some profit


Observation
1) Trendline - Uptrend Bullish
2) Formed higher high - Bullish
3) MACD - Formed 4G1R ( Bearish Reversal)
4) RSI - Falling from 70% ( Bearish)
5) Sto - Bearish crossover ( Bearish)
6) ADX - Good momentum and bullish
7) Candle Stick - 2 black candle stick ( Bearish)

Conclusion
Be on lookout for this counter.

Resistance at 7.30
Support at 6.7


Saturday, March 26, 2011

Tan CHong white soldier detected


Observation
1) Trend Line - Downtrend - Bearish
2) Formed lower low - Bearish
3) MACD - Almost forming bullish crossover ( Bullish)
4) RSI - Break above 30% Bullish
5) Sto - Bullish Crossover ( Bullish
6) ADX - Weak momentum and bearish
7) Candlestick pattern - White soldier and bullish engulfing ( Bullish)

COnclusion
WIth good market sentiment ( Hopefully :D ) , let hope this is have already bottom down and time rise and shine again

Entry Price - 4.75
Stop loss - 4.52
Take Profit -  4.88 (R1) and 5.13 (R2)

Hapseng BB Squeeze.. Once burst up or down?


Observation
1) Trendline - Sideways with Bollinger Squeeze
2) Formed higher low - Bullish
3) MACD - formed 4r1G - Good indication of bullish
4) ADX - Weak momentum ( Sideways) but the bull and bear is French Kissing (Wow). Let wait who will give in either the bear or bull will win..
5) RSI - Rebounded at 50% and uptrend ( Bullish)
6) Sto - k% up and waiting for Bullish Crossover ( Waiting for confirmation)
7) Candlestick Pattern - Bullish Engulfing ( Bullish)

COnclusion
There is a small chances it will burst upwards or downward big time within 2 weeks. Those who are day or position trader can go for this counter..

Entry Price at 6.8
Stop loss at 6.5
Take Profit - 7.05 (R1) and 7.52 (R2)

Thursday, March 24, 2011

Gamuda Potential Uptrend

If breaks above 3.8 the next resistance will be at 3.97 and 4.25

All indicators are thumbs up and good to go if Global Market is still green

Watchout if Dialog Breaks above 2.42


Not a beautiful shape of ascending triangle but potential. Watchout if it break above 2.42 with high volume . Yahoo...

Tuesday, March 22, 2011

MHB look promising for Ascending Triangle


Observation
1) Trend line - Uptrend Bullish
2) Forming higher low - Bullish
3) MACD uptrend with 4r1G Bulish
4) Sto - Bullish crossover
5) RSI - ascending toward 70% bullish
6) ADX -Bullish with low momentum
7) Chart Pattern - Ascending triangle

Conclusion
If break above 6.8 with 1.5 Mil volume it will shoot up pretty higher

Entry Price at 6.75
Target Profit at 7.02 and 7.25

Stop loss at 6.5

Friday, March 18, 2011

Register for Asia Trader & Investor Convention , 2-3 April 2011, Kuala Lumpur Convention Centre

Time to go to free Seminar and learn from expert .

First click on this link www.nextview.com

At the top of the page you will see below banner, click on this and you will get the ticket free. Shown below


See you there :)

Wednesday, March 16, 2011

IJMLAND hit first R1 at 2.8 and now reaching to 2.92


1) First R1 - 2.8 Reach
2) Now reaching to second Resistance at 2.92 (R2) and 3.25 (R3). Those who have bought when we have mention Buy Call at 2.69 will profit more than 10% :)

Please dont be greedy in stock market . Get cash as soon as possible as market is so volatile now..

Change to Bond Fund

Yesterday, i have made some drastic changes in my investment by Switch the Public Select Sector Fund ( Equity) to Public Select Bond ( Bond Fund) due to volatility of the market.

Will switch back to Equity Fund once the market is stable with bullish sign ( Just RM25 for switching :) )


Global Market in Trouble


Observation
1) Forming Lower Low - Bearish
2) Trend Line - Bearish
3) MACD - Bearish with red histrogram
4) RSI - Retracing ( Bearish)
5) Sto - Retracing ( Bearish)
6) ADX - Low momentum and bearish


Conclusion
If it break below the 11700 support the next support will be at 11580 (S1), 11468 (S2) and 10939 (S3)

Monday, March 14, 2011

Market to Volatile.. Rest For a while first..


 Now have to remain in rest mode as the Libya War and Nuclear Meltdown in Japan is still a big uncertainty. If any of this continues the market will remain bearish. Look at Japan Index lose 6% scary... Lets save our bullets first and see what will happen next in 1 month time while monitor any potential stocks.. Hmm time to invest in SGX and short it Yeah..

Sunday, March 13, 2011

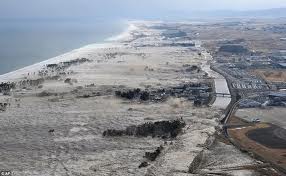
DRHICOM also affected by Tsunami


DRBHICOM formed a lower high and with a black candle stick..

Take Profit it it hit below 1.85

ANN JOO - Watchout


Look like Ann Joo is weaking better take some profit once it hit below 2.88

Will KLSE hit by Tsunami on Tomorrow 14 March


Everybody globally will be worried about Japan got hit by tsunami which might impacted at least 0.5 ~ 1 % of their GDP which Japan was just barely doing positively in the recovery since last 2 years. Will this impact greatly on their economy and stocks which fell about `1.72% in just 1 hour after the TSUNAMI hit.. Will KLSE survive the onslaught on Monday??


Observation
1) Trendline -  In sideway Trend and heading towards the Downtrend Line again ( Slightly Bearish)
2) Formed - Lower high ( Bearish)
3) MACD - Histogram downwards ( Bearish)
4) RSI - Broke below 50% and heading steeply towards 30% ( Bearish)
5) STO - Bearish crossover and heading downwards Below 80% ( Bearish)
6) ADX - Low momentum and bearish ( Bearish)
7) Candle Stick - Gap down with Black Candle ( Bearish)


Conclusion
If KLSE break below the support level at 1492 (S1), let hope it can be sustain at the lower low Support at 1474 (S2)

If break below this the next support will be at 1446 (S3). Really scary.. So better becareful during this Global Turmoil.

Thursday, March 10, 2011

Ijmland - time to take profit


Resistance getting nearer as the 20d ma is coming down


R1 -2.75
R2 - 2.9

S1-2.55

Ann Joo broke the 20d Ma


Wow , thanks to Chart Nexus on the Counter Trend Strategy and those who went in on Monday sure are laughing :) but any how just watchout of the resistance

R1 - 2.97
R2 - 3.04
R3 - 3.15

The support will be at 2.88


Wednesday, March 9, 2011

PCHEM shooting up


Observation
1) Uptrend - Bullish
2) Formed higher high bullish
3) MACD - Bullish and take profit at 4G1R
4) Sto - Bullish but overbought
5) RSI - Bullish but overbought
6) ADX - Momentum weak but bullish

Conclusion
Now currently it is walking up the band and if you see any black candle after hitting the resistance better take some profit first

R1 - 6.84, R2 -7.05 and R3 - 7.17

Tuesday, March 8, 2011

Another Potential Short Thrill LIONIND


Looking for another short thrill and profit.. Here is one counter with potential reward but high risk. Do you have the balls to go in ?

Observation
1)Trendline - Downtrend - Bearish
2) Formed lower low- Bearish
3) MACD - Formed 4r1g potential bullish
4) RSI - waiting to break above 30% for bullish attack
5) ADX - Super strong momentum but bearish
6) Sto - Bullish crossover and breaking above 20% potential bullish

Conclusion
Entry price at 1.68
Stop loss at 1.59
Take profit at 1.89

DRBHICOM rebound but watchout


Observation
1) Trendline - Downtrend  ( Bearish)
2) Formed lower low - Bearish and if break 2.19 then different story
3) MACD - Going up Bullish but beware
4) RSI - Going up and testing 50% ( Bullish)
5) ADX - Bearish and low momentum
6) Sto - Bullish

Conclusion
Watchout the resistance at the 20D ma at 1.99. If there is any reversal here, better take back your losses..

If still goes up hold the profit until any reversal Candlestick or 4G1R signal at MACD

Ann Joo Breakout YEah..


remember to take profit anytime soon :)
Entry Price - 2.75
Stop loss - 2.6
Take Profit - 2.88 (R1) - 5% and 2.97 (R2) - 8%

Monday, March 7, 2011

SEG Watchout

Those who have bought SEG, please better watchout tomorrow there might be a possible drastic movement..


Observation
1) Trendline - Uptrend ( Bullish)
2) Formed higher high ( Bullish)
3) MACd - Bullish but beware of any 4G1R signal
4) RSI - Overbought region and retracing ( Bearish)
5) Sto - Bearish crossover ( Bearish)
6) Candle Stick - Bearish Hanging Man ( Bearish)
7) ADX - Super high volume and bullish ( Beware of bearish because with super high momentum it might drop down like a nuclear bomb

Conclucsion

Ensure Stop loss at 3.40 ( If close below this better take profit fast)
But if break above and close 3.63 then continue to hold

Next resistance at 3.811 and 3.95

KLSE failed to break the resistance..


Today it formed a hanging man on the 20d MA...  If break below the 20D ma , KLSE will start to plunge again.
Please beware

Sunday, March 6, 2011

IJMLAND - Rebounding Possible?


Observation
1) Trendline - Downtrend (Bearish)
2) Formed lower low ( Bearish)
3) MACD - Bearish but formed 4R1G (Possible of bullish reversal for short term profit)
4) RSI - Going up and if break above 30% ( Possible bullish reversal)
5) Sto - Testing the bullish crossover  and above 20% -(Possible bullish reversal)
6) ADX - High momentum but bearish
7) Candlestick - Bullish harami ( Bullish reversal)

Conclusion
Entry Price - 2.69
Stop Loss - 2.59
Take Profit - 2.8 (R1) and 2.92 (R2)

Ann Joo - Possible for short term profit


Observation
1) Trend line - Downtrend (Bearish)
2) Formed Lower low - ( Bearish)
3) MACD  - Bearish but formed 4R1G ( Good for counter trend strategy)
4) Sto - Bullish  Crossover ( Bullish))
5) RSI - Testing 30% ( Bullish)
6) ADX - Momentum weak and bearish
7) Candlestick- Bullish Harami ( Bullish)

Conclusion
There is a possible chances of getting small profit but with high risk.. Well investing is already a risk just small or high risk :)

Entry Price - 2.75
Stop loss - 2.6
Take Profit - 2.88 (R1) - 5% and 2.97 (R2) - 8%

Changing Portfolio to SGX and US

Seeing the sign of market volatility and always waiting for bullish signal to profit it is not a wise able choice. I am currently looking to venture outside of KLSE and venture into Singapore and US stock which i have just register with RHB.

Now will try to analyze a few stock to short at SGX or US stock when the bearish overpower the bull where i can divert my stock from KLSE to bearish counters in SGX and US..

Dow Jones Uncertainty

Well everybody is asking what is going on with Dow Jones?


Observation
1) Trend Line - Hanging at Uptrend ( Slight Bullish but cautious trading)
2) Formed higher low ( Bullish)
3) MACD - Retracing ( Bearish)
4) RSI - Retracing ( Bearish)
5) Sto - K% (Bearish) and %D Bullish
6) ADX - Weak Momentum and Bullish
7) CandleStick - Forming Bearish Hanging Man (Bearish)


Conclusion
Let monitor at the sideline until we can see a clear picture by forming a higher at 12391 and above.

Stop loss at 11980


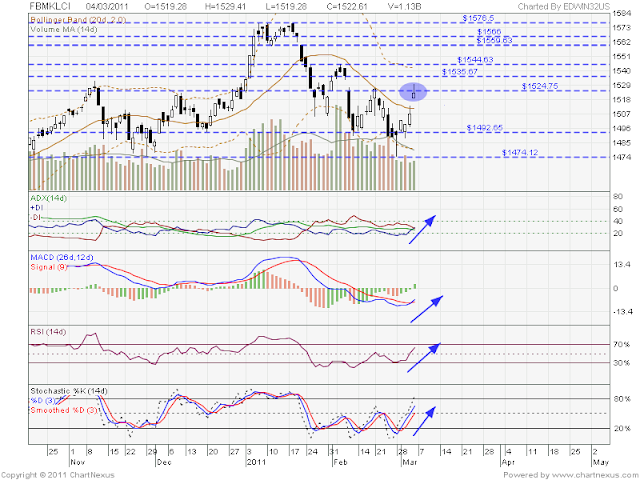
FBMKLCI - Start to rebound or it will retrace even more?


Now currently the market it is too volatile and there is no clear direction where KLSE wants to go but waiting for the Big Brothers to help for direction... But the worse thing is that the Big Brothers like Dow, HSI and Nikkei also dont know what is the current position is..and this my friends, it is a big issue..


Observation
1) Trendline - Downtrend - (Bearish)
2) Formed lower low - (Bearish)
3) MACD - Below 0 ( Bearish) and Bullish Crossover ( Potential Bullish)
4) RSI - Shooting up ( Bullish)
5) Sto - Shooting up ( Bullish)
6) ADX - Good momentum and Bullish
7) Candlestick - Shooting star at resistance ( Potential Bearish)

Conclusion
The Shooting star at the resistance between 1524 and 1535. It need to break above this Gap Resistance and then test another resistance at 1544 which might show a Bullish Reversal with Higher High indication

Stop loss at 1474. If break below this it will be a long way down to 1445 and 1429 . Scary right! so just hold the position on this wild roller coaster ride  :P


Dialog still strong


Observation
1) Trendline - Uptrend ( Bullish)
2) HH - Formed higher low ( Bullish)
3) MACD - Positive Region and 4R1G ( Potential Initiation of Bull run - Awaiting for confirmation)
4) RSI - Going up and testing 70% ( Bullish and awaiting for confirmation on 70% breakout)
5) Sto - Awaiting for Bullish Crossover


Conclusion
Awaiting for the 2.29 Breakout with High volume then this counter will start another bull run with condition of Market Sentiment is positive..

Stop Loss at 2.13
Take profit at 2.29 and 2.42

No updates on Saturday

Sorry everybody that i did not update anything in my blog because i was busy with attend the Chart Nexus Stock Selection Seminar and my computer was spoil.

I went for some shopping at Digital Mall to fix my PC and i just manage to install back New O/S and Chart Nexus.. Will update it on Sunday.


Please stay tune :)


Thursday, March 3, 2011

MHB potential uptrend again


Observation
1) Trendline - Uptrend ( Bullish)
2) HH - Formed high low ( Bullish)
3) MACD - Formed 4r1g ( Potential Bullish)
4) RSI - Testing 70% and breaking it will be super bullish
5 ) Sto - Bullish Crossover ( Bullsih)
6) ADX - Strong momentum and bullish
7) Candlestick- Bullish Engulfing * Bullish

Conclusion
Entry Price at 6.46
Stop loss at 6.3
Take Profit at 6.66 (R1) and 6.8 (R2)

Dayang Formed Bullish Harami


Observation
1) Trend line - Downtrend ( Bearish)
2) Formed lower low - Bearish
3) MACD - Form 4R1G ( Potential start of bull run) wait for confirmation
4) RSI - Going up toward 30%  ( Potential start of bull run) and wait to break above 30%
5) Sto - Bullish Crossover ( Bullish)
6) Candle Stick - Bullish Harami ( Bullish

COnclusion

Entry Price at 2
Stop loss at 1.86
Take Profit 2.15 (R1) and 2.2 (R2)

Wednesday, March 2, 2011

Alam down more and more

Wow.. Look like most of the counter are going down..


Next support at 0.845 and 0.835 and 0.8

DRBHCOM another fallen counter

Ouch.. Very painful, another counter broken the support and make me loss money. Sold all at 1.84 after broke the 1.87 support


Next support at 1.7 (S1) , 1.65 (S2) and 1.59 (S3)

Dialog at the most crucial State


First of all, i would like to apologize on the bad call for Dialog-CC which plunge down until 0.115 even though the mother still support at the uptrend line at 2.17 . I lose a lot too on this warrant..

Now this counter at the crucial spot whether to rebound or retrace to next support at 2.04 ( Higher Low).


NUFFNANG ADS