Talk about everything all under one roof which help us profit big money!!
This blog have Technical Analyze Chart on Selected Stock and Forum for Daily Buy and Sell Call. Enjoy all in one blog for your daily needs for your stock picks.
Everbody heart and eyes almost pop out when KLSE open with - 15 points today but luckily it manage to gather up strength to go up to lessen the damage
Observation
1) Trend Line - Close above the down trend line ( Still slightly bullish)
2) HH - Touch the previous higher low and rebound ( There is still hope)
3) MACD - 4R1G - bullish signal if it maintains the next trading day
4) RSI - At 25% oversold and it is cheap to go in but wait for it to break above 30%
5) ADX - Slightly good momentum but bearish
Conclusion
If close below 1509 - Stop loss and wait for next support at 1493
If close higher at 1531 - Bullish Buy
=-Let talk about another banking counter - Affin ( Laggard) which my benefit from future OPR increase on their interest rate.
Observation - Using Fibonnaci Method due to do not have historical Support or Resistance above this since it has broken the historical resistance before
1) MACD - 4R1G bullish signal at 27 Jan and the Blue signal is moving up
2) RSI - Going up and break the 70% will indicate bullish signal
3) ADX - Momentum pretty high and bullish
Conclusion
Entry Price - 3.62 above the 78.6% Fib Level
Stop Loss - 3.46
Profit - 3.73 R1 and 3.88 R2
I believe everybody read this blog will know what i am talking about Alam..
Observation
1) Trend Line - Below the Trend Line but catching it up again. Going above 1.2 will show it is super bull again
2) HH - Fooling around with support line at 1.12 and manage to rebound up to 1.15 ( Next Resistance)
3) MACD - Finally showing a small green bar ( 4R1G signal) a new beginning of Bull RUn
4) RSI - Now at 58% and waiting it rebound and show a bull run
5) ADX - Momentum slightly good at 27 points and bullish
Conclusion Price
Entry Price - 1.15 and above
Stop loss - 1.1
Take Profit - 1.25 and 1.5
Looking into the steel counter, last week performance was very dull and overall sector is still bad.
Observation
1) Trend line - Still below uptrend line and going sideway
2) HH - Tested the previous higher higher at 12.2 and rebound and formed a Lower High at 12.33 ( not a good sign)
3) MACD - Red Line still above the blue line. Awaiting 4R1G signal
4) RSI - Still retracing ( Bearish) and waiting to rebound from 50% signal
5) ADX - Momentum still good and bullish
Conclusion
Entry Price - 12.5
Stop loss - 12
Take Profit - 12.73 R1 and 12.97 R2
If downward continuation - Better take some profit and wait for reversal at S1 - 53.91 and S2 - 52.24
Current graph on 28 Jan
Observation
1) Trendline - Broke the temporary Downtrend line ( Slight Bullish)
2) HH - Rebound on the previous higher low at 53.91 and going up. If break above 58.65 it will be confirm bullish for safety investor and for risk taker ( Trader) it will be good to collect now and take profit when this overall sector hits the resistance at 58.65
3) MACD - Blue line start to going up and have a 4R1G signal to indicate a slight bullish
4) RSI - Testing the 50% and a rebound from here will indicate a slight bullish
5) ADX - Momentum still good and with bullish signal
Conclusion
Safe Investor
Entry Price - above 58.65
Stop Loss - below 53.86
Take Profit - 59.97
Risk Taker (Trader)
Entry Price - above 56.68
Stop Loss - below 53.86
Take Profit - 58.65 (R1) and 59.97 (R2)
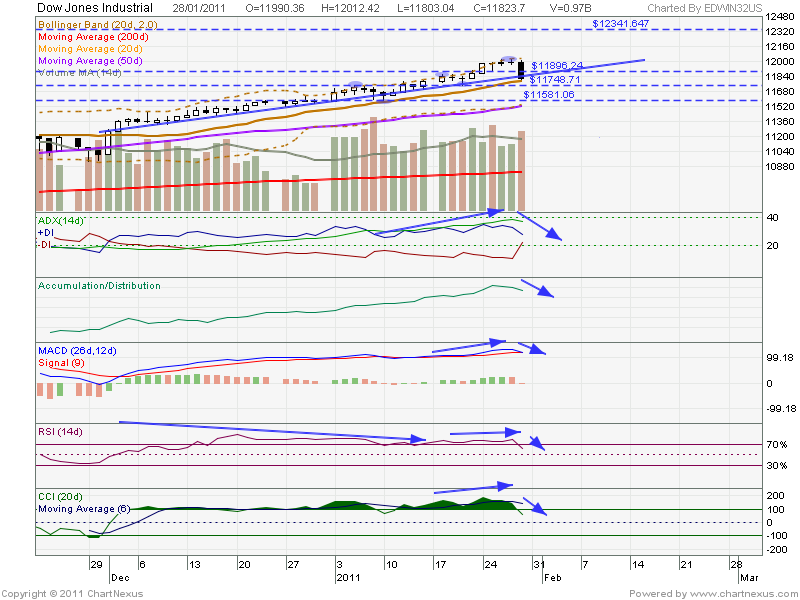
This is what everybody is think.. What is going on with Dow Jones ??
It broke the resistance line 11896 and hoping it will break above the 12000 Physiological Resistance line and hoping for another bull run..
Observation
1) Trend line - Testing the Uptrend line ( Alert Level - Just hope on Monday it will re bounce back again)
2) HH - Retracing toward previous higher low at 11748. Break below this support level will be a negative impact
3) MACD - The blue line is kissing the red line and we got a 4G1R Bear Indicator on 27 Jan.
4) RSI - Broke below the 70% indicating bearish signal
5) ADX - Momentum it is still high and the blue line is retracing show slight bearish
Conclusion
Just do not do anything hasty to cut loss because this might be a normal retracement before going for another bull run.
Entry Price - Above 12019
Stop Loss - 11738 and next support is 11570
Take Profit = 12341
This weekend i went to Malacca to spend some quality time after a week of hard work in my company and stock markets..
We stayed at Da Som Inn just behind Jonker Street which the room rate is pretty reasonable at RM 118 and it was just a few minutes walking distance.
I took a few picture of Jonker street which have a nice Chinese New Year environment and atmosphere compare in KL
Jonker Street
Jonker Street
And the main event why i was in Jonker Street is to eat the famous Baba Chendol at Jonker 88
We came!!!
We Saw ( Yummy many flavour)
We Conquer ( Attack on the Baba Chendol and Malacca Asam Laksa)
ASAM LAKSA with TUNA and without the Famous Prawn Paste ( Maybe it was Malacca style and liking)
BABA CHENDOL - With Thick Gula Melaka and Coconut Cream which make it sweet and creamy..
And conquer this places and this is what is left ..
The time we spend in Malacca was good but we could not spend much time into walking at the Jonker Street because it was raining from Saturday Morning until Sunday Afternoon. This is the first time i visit Malacca in a rainy day and normally we got sun burn from the the sunny weather there
This is what we call stock market. Everytime we think that the bleeding has been stop and rebound , it will drop again in a few days because of other factors from other countries..
I believe many people have started to accumulate again after seeing KLSE rebound strongly at 1507 support line and invested again hoping to earn money from the higher low and potential it might go up above 1570
Observation
1) Trendline - Broke the downtrend line but not able to break the resistance at 1531
2) HH - Tested the higher low at 1507 and went back up to 1521. Waiting it to go up above 1576 previous higher high to confirm bullish run
3) MACD - Red Histogram is saturating and waiting for a 4R1G entry point
4) RSI - Still at oversold region in 23.2% and waiting to break above 30% to show initial confirmation on bull
5) ADX - Still with good momentum at 32 points and with bearish signal
Conclusion
Let wait for the Noise and other factors to be removed and settle down before we go attack at full force. Too bad i also made a harsh attempt to go in 30% into KLSE again hoping to grab it at low price :)
Entry Price -
1) Wait till in break above 1531
2) MACD - 4R1G
3) RSI - Break Above 30% oversold region
4) CCI - Break above 0%
Stop Loss
1) Break below 1507
Take Profit
1) Take at least 50% profit from your stock when reaches the previous higher high at 1576
Bought Alam back few days ago at 1.11 at 500lots and happy to see it going up
Observation
1) Formed higher low at 1.1 and now it is a new support
2) MACD - High chances of Kiss Of life tomorrow with Blue line going up
3) RSI - Saturating at 62% and waiting to go up
4) ADX - Momentum at 27 points and bullish
Conclusion
Entry Price at 1.15 ( Safe mode) and 1.11 ( Risky Mode)
Stop loss at 1.1
Take Profit at 1.25
Wow suddenly a big miracle then Air Asia manage to get it engine working last minute before crash landing and flying up again..
Observation
1) Trend line - Broke Above the down trend line and close at 2.83 ( Starting of a nice bull run)
2) HH - Manage to rebound at the previous higher low at 2.7 and close 2.83 ( Good news)
3) MACD - Finally a 4R1G signal Bullish attack signal
4) RSI - Rebound at 50% and close at 54% Bullish attack signal
5) ADX - Momentum slightly good and bullish since it kiss the bear and go up again
Conclusion
Good chance to accumulate
Entry Price - Now
Stop Loss - 2.7
Take Profit at 3.02 - 10% profit Good :)
Based on the chart it is visible that KLSE is trying very hard to break the Downtrend line.
Observation
1) Trendline - Trying breakout from the downtrend line ( BULL fighting BEAR - not sure who is the winner)
2) HH - Testing the reistance at 1531
3) MACD - The histogram is stablizing and waiting for 4R1G to confirm bull run on 29 JAN
4) RSI - Now at 27% which is overbought and by going above 1531 will show breakout from oversold which indicating start of a new bull run
5) ADX - HIgh momentum at 32 points and bearish is reducing
Conclusion
Look like the Bull Sign is getting clearer and waiting for tomorrow breaking the 1531 to show it will be a new start of a bull run again. Hooray
4)
Observation
1)Trend Line - Below the down trend line
2) HH - Broke the previous Higher low and going toward 0.645
3) MACD - Red line above blue line ( Bearish Signal)
4) RSI - Currently at oversold ( Bearish Signal)
5) ADX - Very low momentum at 13 point with bearish signal ( Downtrend slowly or sideway trend)
Conclusion
Cut loss at 0.665 and wait for this counter to rebound at this criteria
MACD - 4R1G
RSI - Break above 30%
Trend line - Break above the downtrend line
Lets discuss on gossip, news, buy call, sell and any analysis that will help us to win money Yeah!! Please ensure to register for free to view the daily stock tips on Buy Call, Rumour and News. You will never regret this because it comes with Entry Price, Stop Loss Price and Take Profit Price.. :).. Join the club for free...
Observation
1) Trendline - Downtrend line
2) HH - Testing the higher low at 6.64 support line ( Break this next support at 6.45)
3) MACD - Bearish
4) RSI - Bearish
5) ADX - High momentum at 46 and bearish
Conclusion
Hold until it rebound on the support line at 6.64 or 6.45 and break the Down trendline and if tomorrow close higher entry price will be at 7.05
Luckily i cut loss when it broke the 3.75 support line. Now it is free falling from the previous support to ward the new support at 3.49. Now very hangus...
Made a wise movement to sold this counter few days ago
1) KENCANA -CD sold at 0.4 and now at 0.345 ( Yeah if not will lose another 20%)
2) ANNJOO WB sold at 0.71 and now at 0.7 ( Not that good)
3) KFC-CA sold at 0.145 and now at 0.135 ( Good call)
Today
Buy
Alam at 1.11 500lots
Sold
Gens-cc at 0.145 1000lots
Mitra at 1.86 100lots
Today Gamuda went up a bit and close at 3.8 with spinning top (indecisive marker)
Observation
1) Trend line - still below the downtrend line (BEARISH)
2) HH - Heading toward previous higher low at 3.86 (BEARISH)
3) MACD - Bearish and histrogam still red and longer (BEARISH) - Waiting for 4R1G
4) RSI - Nearly at oversold at 32% waiting for rebound (BEARISH) - Waiting to rebound at 30%
5) ADX - Momentum is still their with bearish signal
Conclusion
Entry Price - 3.85 with 4R1G signal . With this we will see a strong support there will be a rebound at RSI. If does not reach this entry price please do not go in because it is still risky
Everybody is talking about Air Asia whether it will survive the crash land or not. It is still in progress but we it is still not clear
Observation
1) Trendline - Still remain below the Down Trend Line (Bearish)
2) HH - Previous Higher Low acting as Resistance Line and testing it but fail to break it (Bearish)
3) MACD - Still bearish and the Red Line still above the blue and without any 4R1G signal
4) RSI - Still bearish and now at 46%
5) ADX - At 31 point slightly above average momentum and bearish
Conclusion
Do not enter this counter yet as we have not see really any real reversal on this counter.
Entry Price - RM 2.85 with MACD histogram 4R1G signal
Wow, I was testing on multiple Advertiser to check which provide the best income and i have tried on
Nuffnang - So far i got only RM0.45 (Based on impression and CTR)
Adside - So far i got USD 2.13 (Based CTR only) not very good if people does not click
Advertlets - So far i got RM 6 ( Based on Impression)
Adbrite - i got USD 4.43 ( Based on Impression and CTR) -- OMG!!
I just sign up last week (Friday Jan 20) and manage to get USD 4.43 nice.... Those who interested to gain extra side and sweet income in USD , you can click on the Adbrite Logo to go into the link below
Broke the Uptrend line and Support line at 2.7 and now crash landing..
Observation
1) Trend Line - Below the downtrend line and crash landing more
2) HH - Broke the previous higher low - Double Bearish Attack
3) MACD - Indicating Bearish after Red Line above Blue Line
4) RSI - Broke below 70% and testing 50%
5) ADX - High momentum but bearish
Conclusion
Today it broke down the support line at 2.7 and heading downward somemore.
Wait until it retrace further and slow down toward 2.53 and let wait for a rebound here again with 4R1G MACD signal.
News from BTIMES
Analysts say the selling may not be done as yet, with some advising value-hunter investors to be on their guard to pick up the stock for long-term investment
Shares of AirAsia Bhd (5099), South-East Asia's biggest low-cost carrier, fell sharply yesterday as foreign funds took profit after recent gains. Analysts said the selling may not be done as yet.
Some advised value-hunter investors to be on their guard to pick up the stock for long-term investment once the selling is done, as they see nothing fundamentally wrong with the company.
The stock fell by as much as 8.5 per cent to RM2.69 before gaining some ground later in the evening to close just 4.1 per cent or 12 sen lower to RM2.82.
The losses were mainly because of foreign selling, said an analyst from RHB Research.
"I would think it's profit-taking. Over the last one or two months when foreign funds were rushing in, the share price went up sharply. So now it's a reversal of this process," he told Business Times.
AirAsia has substantially higher foreign holdings compared to the average company. Foreigners held some 51.55 per cent of the stock as at end-2009 compared with the average holding of about 22 per cent in other stocks.
The RHB analyst believes there may have been a bit of an asset re-allocation in emerging markets, with some of the foreign money moving back to developed markets.
While most analysts have a "buy" on the stock, he kept his "underperform" recommendation and fair value of RM2.10 as he expects competition between AirAsia and the low-cost arm of Malaysia Airlines, Firefly Sdn Bhd, to intensify over the next six to 12 months.
Maybank Investment Bank (MIB) Research said the selling was purely sentiment-driven and followed a selldown in low-cost carriers EastJet and Ryanair in Europe late last week. UK-based EasyJet had said its first-half losses may double from the year before.
While happenings in the European aviation market may not have much to do with AirAsia, the fact is the carriers may share common shareholders.
"These shareholders are possibly common shareholders of EasyJet and Ryanair, and after seeing what happened to their holdings, decided to realise profits and discount accordingly. This is the stock market after all, these things happen," an MIB Research analyst said in a note to clients yesterday.
AirAsia is a "buy", but it is a very volatile stock and so "a strong stomach" is needed to reap rewards, he cautioned. Its volatility has surged by 24 per cent from a year ago, making it one of the most volatile index-linked stocks at home and also the second most volatile LCC stock in the world.
The analyst has a RM3.36 target on the stock , implying a 19 per cent potential upside from yesterday.
"Value hunters, be on your guard. This is a fabulous opportunity to join in the party if you have missed it the first time. There is of course the possibility that the share price will come down more... but on a longer term horizon, we think this is a wonderful opportunity to buy," he said.
AirAsia carried 25.7 million passengers in 2010, 13 per cent more than it did the year before, it said in a statement yesterday. Its load factor increased to 78 per cent from 75 per cent.
KLSE onslaught is taking many counter down with her and DRBHICOM could be next
Observation
1) Trendline - Bearish and below the downtrend line
2) HH - Reaching to previous higher low at 1.89, break this support line there will be a strong free fall
3) MACD - Bearish
4) RSI - Bearish at 33%
5) ADX - High momentum at 45 with bearish signal
Watchout for the support line at 1.89. It will either break downwards and head for the next support line at 1.74
Entry Price at RM 2 ( Watch this closely to catch huge profit if KLSE rebound)
- Form new higher low
- Rebound RSI at 30%
- MACD show 4R1G
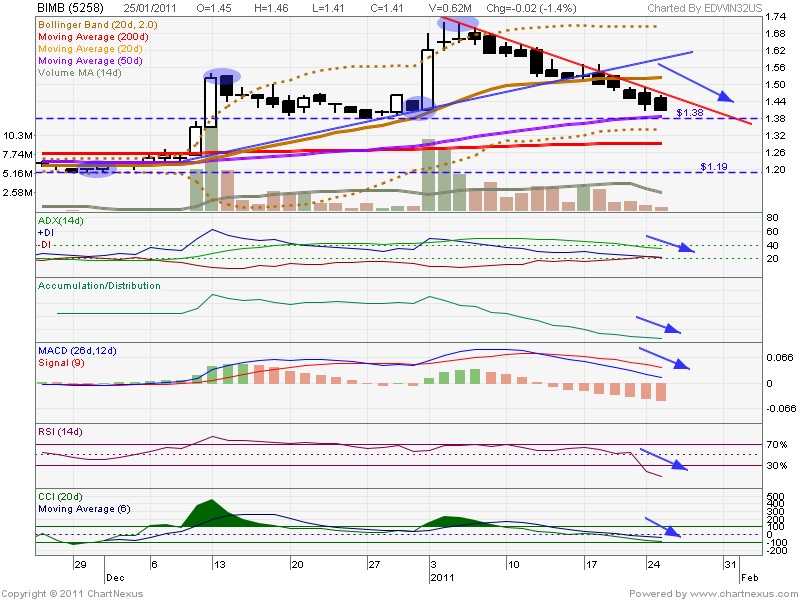
Look at this counter. Walaoo!!! Never want to go up and sky diving down again??
Observation
1) Trend Line - Following downtrend and skydiving ..................BOOM
2) HH - Reaching to previous higher low and 50d MA at 1.38 ( DANGER) watchout... If rebound ok but it go down again this will be a nuclear bomb (KABOOM!!)
3) MACD = Bearish with higher red histrogram - No good
4) RSI - Super duper discount at 5.5% OMG!!!! Very very oversold like SUPER DUPER BEAR!
5) ADX - Still at 33 and bearish
Conclusion
Please hold any attempts to buy this counter eventhough super cheap. Wait until to goes back up to 1.5 before thinking of going in again. This is very SUPER BEAR counter
Observation
1) Trend Line - Still below the downtrend line sigh....
2) HL - Broke the 50d ma and going down toward the previous higher low 2.8 (Danger)
3) MACD - Red alert red alert bearish..
4) RSI - Bearish to 50%
5) ADX - At 27 Marginally weak and bearish
Conclusion
Hold from buying because this clearly shows downtrend and high chances to go down further
Entry Price - Go up above 2.97 or wait till it rebound slightly above 2.8
Cut Loss - Now now !!
Sure now everybody wondering why global going up and KLSE still have not stop bleeding. No one knows the answer..
Observation
1) Trendline - Going down following the trend line with a big black candle -16.5 points
2) HL - Heading towards the previous higher low at 1509 and will it rebound at the 50d moving average at 1522
3) MACD - Bearish
4) RSI - now at 37% reaching to oversold. Hopefully within 2 -3 days it will probably rebound back at 30%
5) ADX- Momentum high with bearish signal
Conclusion
Entry Price at 1355 and do not go in if below this amount because we are waiting for KLSE to rebound either at 50d Ma at 1522 or before the higher low at 1509
Dow jones is now testing the 12000 resistance line yesterday and with this will KLSE stop bleeding and bull run again..!!
Observation
1) Trend line - Below down trend line and hope with Dow Bull we can see KLSE break the downtrend line
2) LL - Retracing toward previous higher low at 1500
3) MACD - Red Line above blue line showing bearish and awaiting for 4R1G for bullish attack
4) RSI - GOing down toward 50% and waiting for bullish attack for rebound
5) ADX = Strong momentum at 34 with bearish signal
Conclusion
If Klse able to turn around to stop bleeding close higher we will be able to have higher low which show another bull run meanwhile hold from buying first awaiting confirmation
I have been talking sad stories about my 3 losses and let talk about potential counters to buy
Sure everybody loves Gamuda
Observation
1) Trendline - Below Trend line and supported by support line at 3.88
2) HH - Retracing towards previous higher low at 3.8
3) MACD -Red above Blue ( Bearish) and waiting for 4R1G for the new start of bull
4) RSI - Bearish and testing 50%
5) ADX - Momentum at 32 and bearish
Conclusion
Entry - 3.92 with 4R1G at MACD histrogram
Stop Loss at 3.85
Take Profit = 4.45
I have been watching the KFC counter so closely like this 2 gentlemen staring at the Fried Chicken and ready to sell any time hehe..
I sold my KFC-CA at 0.145 once KFC broke down below 3.75!
Observation
1) Support Line - Broke 3.75 and and close at 3.73. Next support at 3.53 ( long way down)
2) MACD - Bearish
3) RSI - Hitting the 30% super bearish !!
4) ADX - Momentum at 8 indicating sideways with bearish signal
Conclusion
Hold your horse into thinking of jumping to buy cheap KFC. It may go down further toward 3.53
I was thinking Ann Joo will rebound and gain back my losses but i was dreaming Zzzzz. With KLSE sentiment bad it drag Ann Joo further down..
Observation
1) Trend Line - Confirmed form a downtrend line after black candle today
2) LL - Tested the 20d ma and retracing toward the previous higher low
3) MACD - The red line cut the blue line showing bearish
4) RSI - Down toward 50% bearish
5) ADX - High momentum with bearish signal
Conclusion
Wait for rebound at 20d ma and if further bearish and break the 20ma better stop loss and wait for second round at 2.8 but if tomorrow it goes up above 3 then there will be change to go back uptrend.
Everybody ask why i cut loss and why do not hold this longer. Well i rather cut loss to lose a bit and then collect lower and earn more.
Observation
1) Trendline - Broke far away from the uptrend line and will start to create a downtrend line temporary (BEARISH)
2) LL - Broke the previous Higher Low at 2.52 (BEARISH)
3) MACD - The blue line is getting further lower than the red line ( Bearish) and look at the Red histrogram getting longer
4) RSI - Plunging down quickly toward 50% (Bearish)
5) ADX - At momentum 49 and bearish - Bearish strong
Conclusion
Stop loss and wait for another sign of reversal towards next support at 2.47 and 2.35. So rather than losing money and hold until 2.35 and rebound i rather cut loss at 2.5 and the buy again at 2.35 if rebound and once reach to 2.5 at least i earn money compared to break even :)
Observation
1) Trendline - Downtrend line and retracing
2) HH - Downward and forming lower low
3) MACD - Bearish signal
4) RSI - Bearish Signal
5) ADX - At 29 with bearish signal
Conclusion
Do not try to accumulate this counter because it is going down with all indicator showing bearish. Let wait this major reversal with breaking above the trend line and formed higher low and higher high.
This counter is new and Technical Analysis on this counter is limited by will try my best to help my visitor to review this counter
Observation
1) Trendline - Broke the Uptrend line - Bearish
2) HH - Retracing from the Higher High but still far away from previous higher low at 5.81
3) MACD - Limited data but showing bullish
4) RSI - Retracing but if on Monday break above the uptrend line possible to rebound
5) ADX - At 44 which is having high momentum but bearish
Conclusion
Entry Price = 6.3
Stop Loss = 6
Take Profit = 6.6
Previous mention in the bullish flag breakout our TP is at 2.38
Observation
1) Trendline- Still above the trend line
2) HH - Form Higher HIgh at 2.09 and retracing
3) MACD- Bullish
4) RSI - Bearish
5) ADX - High momentum and bearish
Conclusion
Continue to hold this counter and take profit/cut loss if break below 1.92.
Observation
1) Trendline - Downtrend
2) HL - After hitting the High high at 3.1 and now retracing and watchout the previous higher low at 2.86. Below this it will confirm a big reversal and downtrend
3) MACD - Just beginning of bearish and there is a potential of reversal with 4R1G
4) RSI - Downtrend
5) ADX - Momentum low at 23, indicating sideway trend
Conclusion
Entry Level at 3
Cut Loss = 2.84
Take Profit = 3.1 and 3.2
Observation
1) Trend Line - Broke the Uptrend line at 2.65 and close at 2.59. Monday will be a decision point whether this counter will rebound or continue to downtrend because heavily supported by support line and by 20d ma at 2.58
2) HH - Still above the previous higher low 2.5
3) MACD - Bearish and waiting for 4R1G for reversal point
4) RSI - Broke the 70% line and bearish
5) ADX - At high momentum and bearish
Conclusion
Entry Price = 2.7 ( Above uptrend line)
Stop loss = 2.5 ( Previous Higher Low)
Take Profit = 2.96 (R1) and 3.2 (R2)
Any charting on MAA, something could be cooking there.
This post has been edited by SKY 1809: Today, 05:01 PM
Observation 1) Trend line - Above the uptrend line and if closing above 0.91 high chance of big bull run until 1.18 next resistance 2) HH - Higher low at 0.84 compare to previous higher low at 0.805 3) MACD- Bullish 4) RSI - Rebound from 70% Bullish 5) ADX - HIgh momentum at 58 points with bearish signal
Conclusion This counter is a good counter to watch Entry price at 0.91 Cut loss at 0.84 TP price at 1.18
In addition, there is a rumour that Prudential or AIA wants to takeover this company but this rumours has not been confirmed yet. Well wise man say buy on rumours, sell on news hehe


